

This example is for a Real-Time Embedded System.
Background
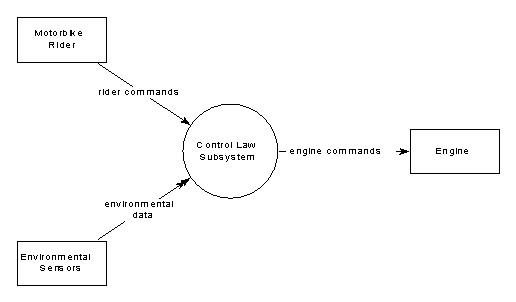
The subsystem for which reliability needs to be determined is part of an Engine Management System (EMS) for a new motorbike. The subsystem, shown below, implements the Control Laws (CL) for the EMS, which transform engine and environmental data into required engine settings. Control Laws define how the engine should respond in different conditions, such as what fuel-air mixture should be used for a given throttle setting and environmental conditions and are generally presented as a set of equations. The subsystem runs on an 8-bit micro-controller and is written in machine code.
 |
Establish Reliability Goals
The CL subsystem can fail in two ways. Firstly, a major failure is when one of the output engine settings is more than 30% from the value specified in the published control laws. The published control laws have been produced using computer-based models and are provided as FORTRAN code (and as derived mathematical formulae). They can be executed on the project's VAX minicomputer. A minor failure is when one of the output engine settings is more than 3% from the value specified in the published control laws but not a major failure. Two or more consecutive minor failures are considered as a major failure.
The CL subsystem runs 10 times per second and the motorbike manufacturer (the client) has set a reliability requirement of no more than 1 major failure every 10 hours of operation.
Define Operational Profiles
The operational profile provided by the motorbike manufacturer comprises two parts.
The motorbike is destined for the Outer Mongolian market and so the environmental data that the subsystem will encounter in operational use must match that of Outer Mongolia. Luckily this data is available from the Royal Geographical Society, and their data has been used to build thirty environmental data profiles that cover the extremes of weather, and stages in between. To ensure that a realistic profile of environmental data is used then each profile has also been assigned a probability of occurrence.
The engine data to be used is purely based on a profile of journey times that the motorbike will undertake from a cold start. The manufacturer was asked if different task and starting states (other than from cold) should be considered, but stated that this was unnecessary. The manufacturer has provided the functions for calculating the change of engine data over time and have provided the expected distribution of journey times, as shown below.
|
Hours |
0-0.2 |
0.2-0.4 |
0.4-0.8 |
0.8-1.5 |
1.5-3.0 |
3.0-6.0 |
6.0-10.0 |
|
% |
12 |
31 |
28 |
18 |
7 |
3 |
1 |
Plan and Execute Tests
No particular set of inputs have been identified as being more critical than others, so the generation of test cases from the operational profiles is based purely on likelihood of occurrence.
It was decided not to simply select pseudo-random pairings of environmental data and engine data based on their probability of occurrence to generate a test cases. Instead it was agreed with the manufacturer that test scenarios would be generated, which would comprise a set of test inputs representing a particular journey, where each journey would be assumed to take place under a single environmental profile. The test scenario would be based on choosing a length of journey and environmental profile based on their individually defined probabilities of occurrence. The test inputs that make up a scenario would then be generated all with the same environmental profile, but the engine data would be calculated using the provided function, based on the time into the planned journey.
The testing will be carried out on the target hardware running on a test rig controlled by the VAX minicomputer. Test scenarios will be chosen pseudo-randomly by a program provided with both the environmental and engine data profiles. For each test scenario then an ordered set of test inputs for the chosen journey will be generated using the selected environmental data and calculated engine data. These test inputs will be passed to the test rig and the resultant engine settings read from the rig and stored in a file. After each test scenario is completed, then the FORTRAN implementation of the control laws will be used to generate the required values for the engine settings and compared with those produced by the micro-controller (it should be noted that in many instances the expected results will have to be generated manually and that system failure is also often not detected by comparing actual and expected outputs, but rather by the system ‘crashing’). The rate of occurrence of major failures (as defined earlier) is recorded for later analysis. All failures are reported to the developers, who fix the corresponding faults, and the new release is then provided for further testing.
Use Test Results to Drive Decisions
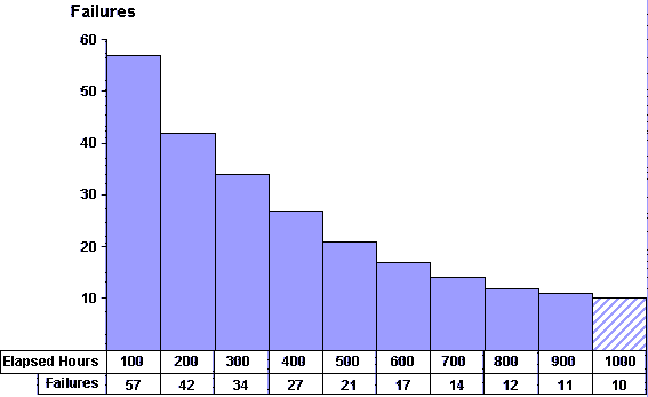
The following graph shows the rate of occurrence of failures against hours of elapsed real time (real time is calculated by knowing that 36,000 test inputs correspond to one hour's operation). It forms a normalised reliability growth curve for the subsystem. The reliability growth curve for your system needs to be chosen carefully. Tools are available that analyse a set of failure data to determine the reliability growth curve that most closely fits the currently-available data. The choice of growth curve should be justified, although a ‘good fit’ is typically accepted as sufficient justification. The number of discovered failures were counted for each hundred hours. After 900 hours the required reliability level was reached as it was now possible to predict that in the next 100 hours there would be 10 failures (as shown on graph), which is equivalent to 1 failure in every 10 hours and the software was ready for delivery.
